
For a technology as ubiquitous and convenient as the internet, it is easy to assume that the benefits of going online are readily accessible to all.
In reality, a range of factors which can shape what people ‘get out’ of using digital media such as the internet, including their skills, access to technological resources, and usage motivations. These can in turn vary according to other personal characteristics, such as age, gender, location, and socio-economic status, creating a divisions between those who benefit from using the internet and those who miss out. “Digital inequality’ refers to the idea that these are systematic and persistent differences which can tangibly impact on people’s lives, advantaging some whilst disadvantaging others.
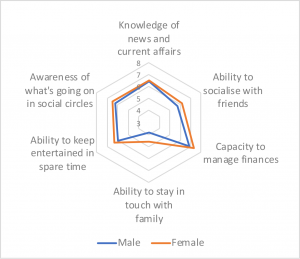
As part of the Our Lives project, we are learning more about digital inequality amongst young Australians. To gauge how much respondents rely on the internet, in 2017 we asked respondents (who were then aged 23-24) to rate how much certain areas of their lives would be disrupted if they lost internet access for one week. We use their responses to create their unique ‘digital disruption footprint’: a visual map of showing the spread of disruption across these different areas of their lives.
These footprints reveal valuable insights. Internet use was found to be the most essential for a respondent’s capacity to manage their finances, whereas it was less important for their ability to stay in touch with family. Comparing these footprints helps to indicate the kinds of factors which shape digital inequality. For instance, female respondents were found to have broader larger disruption footprint then males. In particular, females were likelier than males to rely on the internet to socialise with friends and stay in touch with family.
Education was another factor which mapped onto differences in digital disruption. Respondents who had completed vocational education displayed a narrower disruption footprint to those who had either completed university education, or no further education since leaving high school. This difference was apparent in the lower numbers of vocational graduates who relied on the internet for their knowledge of news and current affairs.
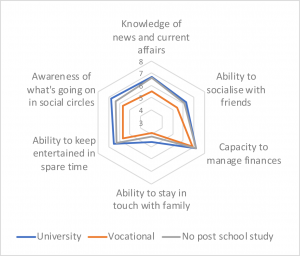
Lastly, it is important to understand why variations such as these might arise. Some of these may reflect certain groups lacking the need or skills required for a particular kind of use. For instance, vocational graduates may rely less on internet use for news and current affairs if they have not developed information-seeking skills and practices associated with this. In other cases, internet access is a major factor shaping one’s digital disruption footprint.
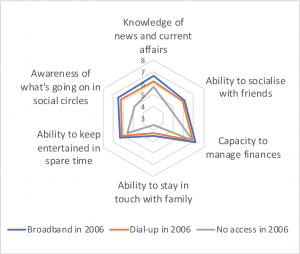
To illustrate such barriers, we examined the differing footprints of respondents based on their internet access over ten years earlier when the Our Lives project began. While there were relatively few differences between those who had dial-up or broadband access in 2006, respondents who had no internet access at all in 2006 still displayed a much narrower footprint – a whole decade later. Such long-term differences are important for understanding the experiences of young adults in regional and rural areas with historically poorer internet access coverage.
These findings show that even as the internet becomes a routine feature of everyday life, creating countless new possibilities, young Australian adults are far from sharing equally in the benefits of this new digital age.
Jonathan Smith